Heat-Related Illness: Data Dashboard and Guidance
Heat can be dangerous.
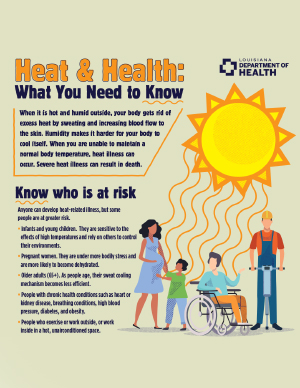
When it is hot outside, the body gets rid of excess heat by sweating and increasing blood flow to the skin. Humidity makes it harder for the body to cool itself. Heat-related illness (HRI or hyperthermia) happens when the body is unable to maintain a normal body temperature.

Frequently Asked Questions
Who is at risk of heat-related illness?
- Older adults don't sweat as much as younger adults, and they are more likely to have chronic health conditions.
- People with chronic health conditions such as heart or kidney disease, respiratory conditions, high blood pressure, diabetes, and obesity.
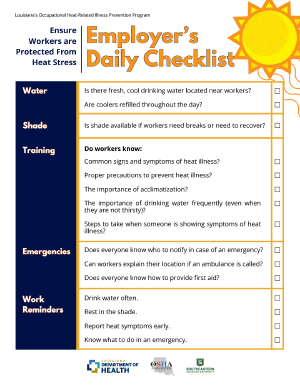
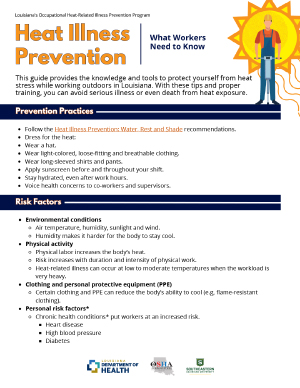
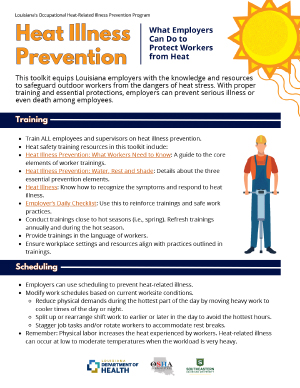
- Outdoor workers and some indoor workers who work in a hot, unairconditioned environment. Visit the Louisiana Occupational Heat-Related Illness Prevention Program for more information about workers and heat.
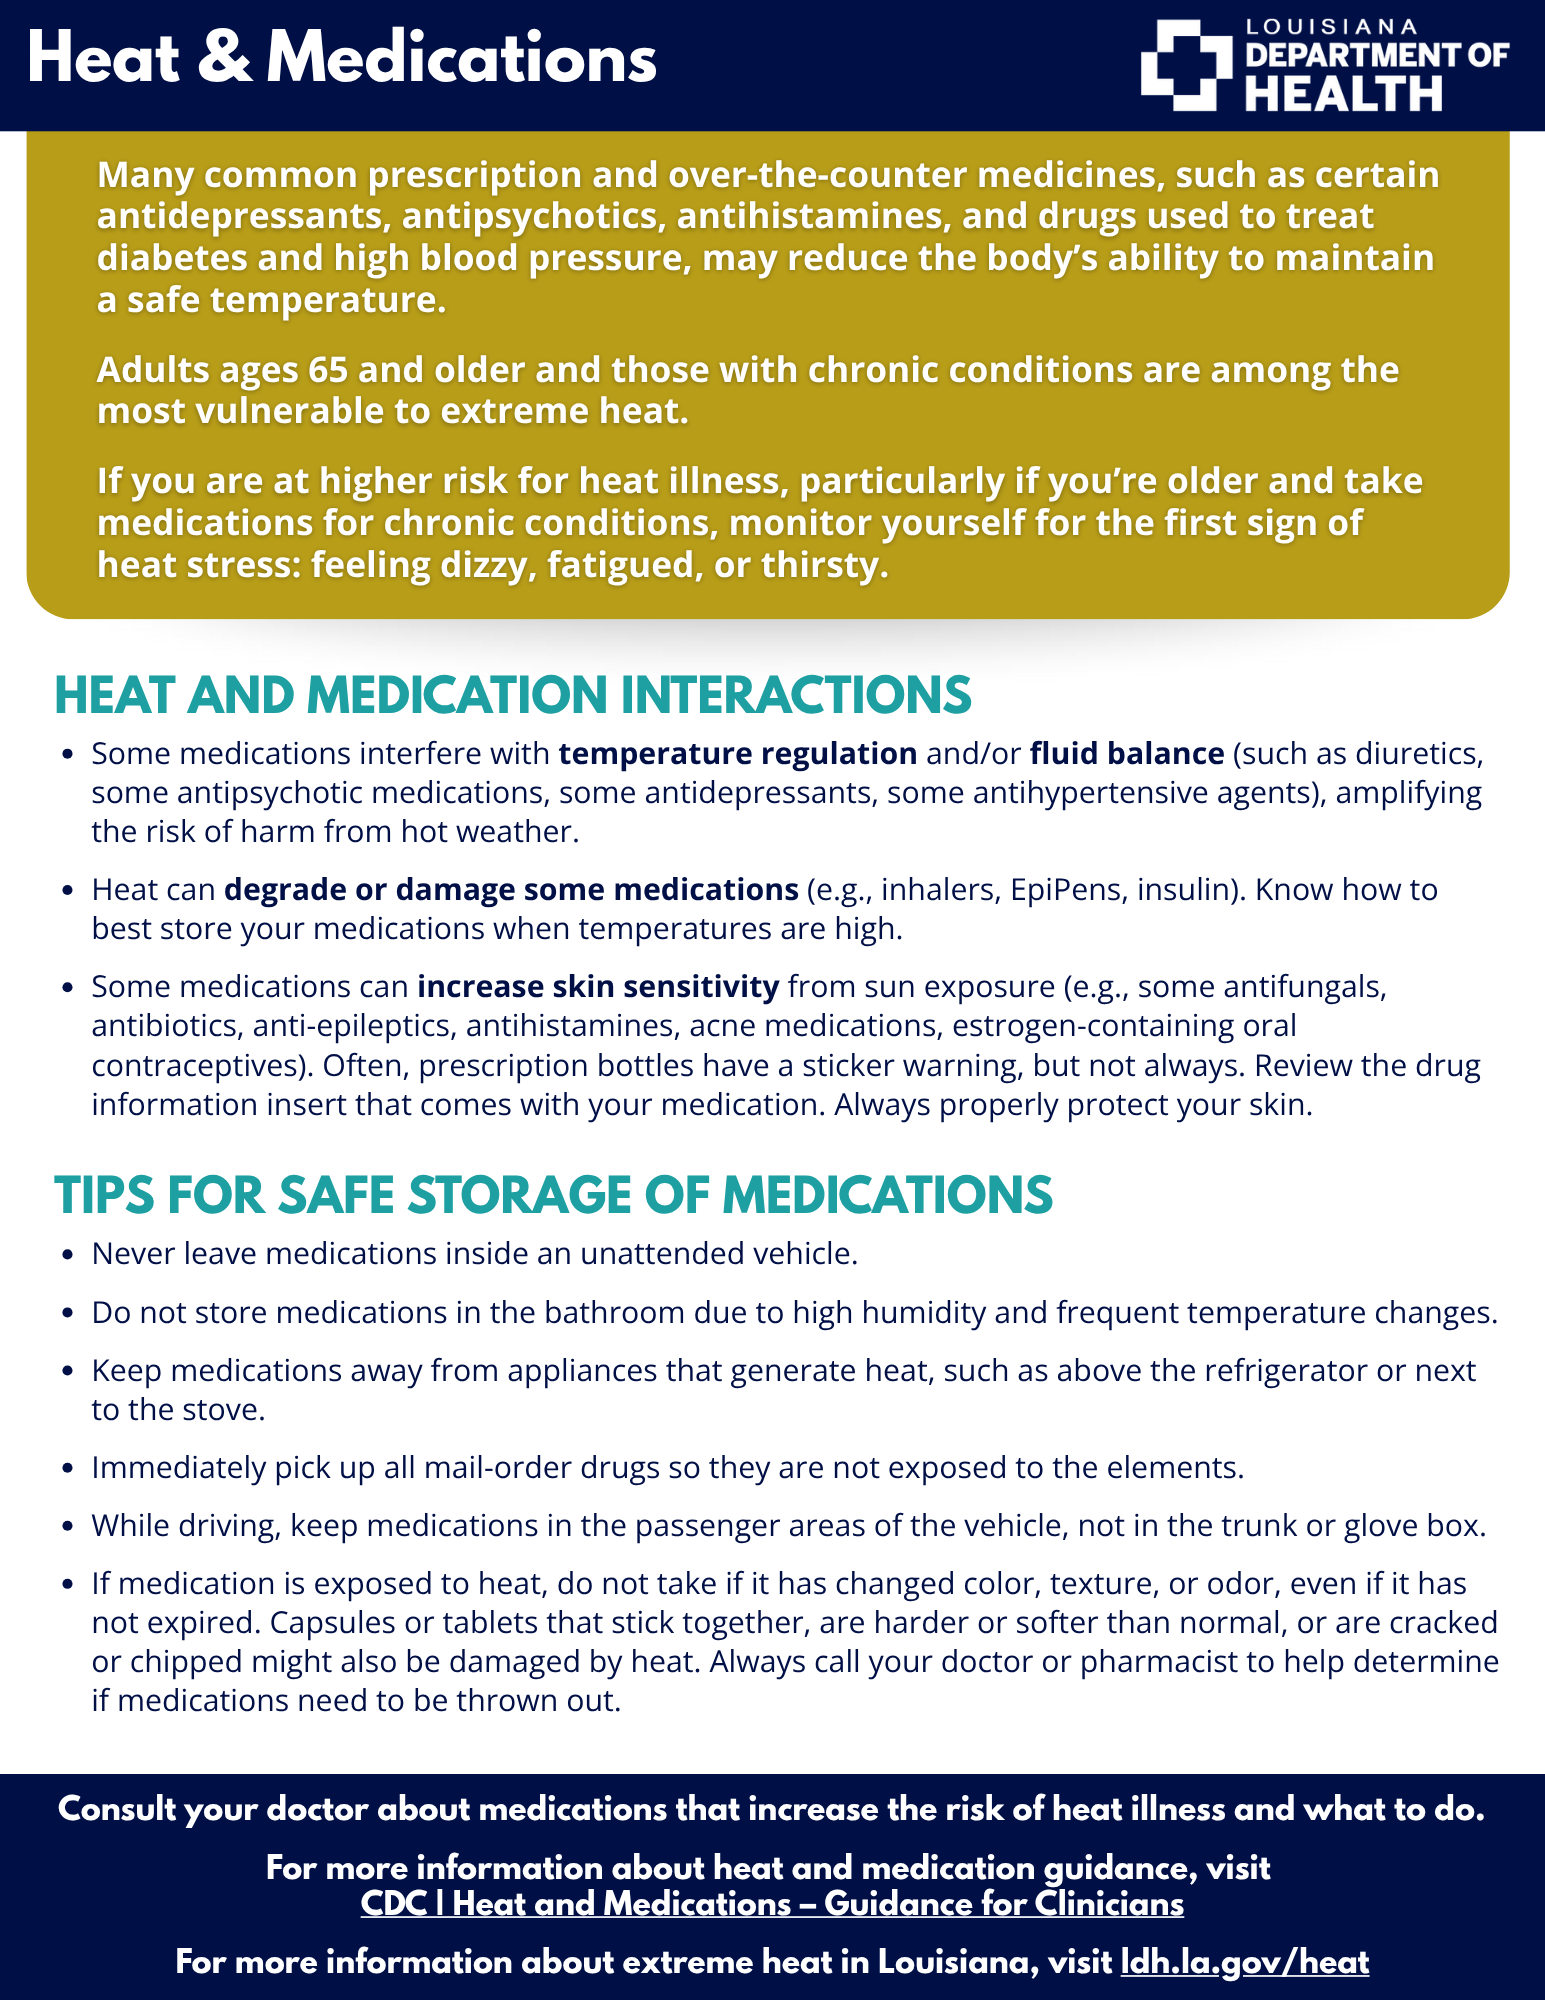
- People who take certain medications (which can affect how the body controls its temperature, holds the correct amount of water, or makes the skin more sensitive to the sun). Download LDH’s fact sheet or visit the CDC's Heat and Medications - Guidance for Clinicians for more information.
- Athletes and people who exercise outside.
- Unhoused individuals and people living in buildings with no or limited air conditioning.
- People who are socially isolated or have limited mobility.
- Infants and young children are sensitive to the effects of high temperatures and rely on others to control their environments.
- Pregnant women are under more bodily stress and are more likely to become dehydrated.
- People who use substances like drugs and alcohol. Some substances increase the effects of heat stress on the body, while others can mask the symptoms of heat illness.
How can I protect myself and others from heat-related illness?
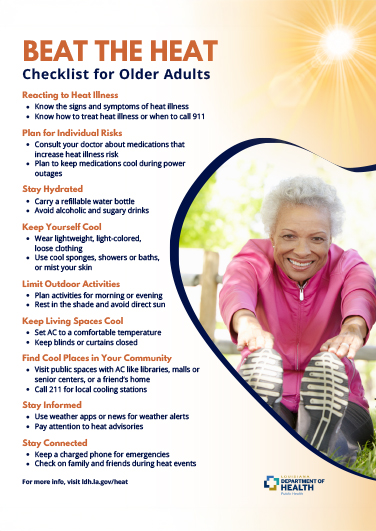
- Stay informed: Keep an eye on weather forecasts and heat advisories so you know when extreme heat is coming and how long it will last. Sign up for emergency alerts.
- Stay in air-conditioned spaces. If your home is not air-conditioned, visit a cooling center, shopping mall, or library. To find a cooling center in Orleans Parish call 311 or go to Nola Ready Website. For other areas of the state, news outlets are the best sources.
- Contact the Low-Income Home Energy Assistance Program (LIHEAP) if you need help with home energy expenses such as bills, cooling equipment, or repairs.
- Keep your home cool. Wait until nighttime to use appliances that get hot, like the oven, clothes dryer, and iron. Wash hot-water loads of laundry at night. Close your blinds or curtains during the day. Use window reflectors specifically designed to reflect heat back outside.
- Stay hydrated. Drink water throughout the day. Don’t wait until you’re thirsty. Thirst is not a good indicator of hydration. Avoid alcohol, caffeine, and sugary drinks. Water works best to prevent dehydration, but after heavy exercise or periods of heavy sweating, you may need to replace electrolytes and fluid. Many sports drinks effectively restore body fluids, electrolytes, and salt balance. Symptoms of electrolyte imbalance are muscle twitching and cramps, increased thirst, salt craving, and irritability.
- If you are outside, wear sunscreen, a wide-brimmed hat, and sunglasses. Wear loose-fitting, lightweight, and light-colored clothing to reflect heat and sunlight.
- Avoid outside activities during the hottest part of the day (usually 10 AM to 4 PM).
- Never leave children or pets alone in vehicles. Look before you lock!
- Check your meds. Talk to your doctor or pharmacist to see if any of your medications affect your body’s ability to regulate temperature. Visit the CDC's Heat and Medications for a summary of how heat can affect medications and health.
- Look after each other. Check in on family, friends, and neighbors, especially the elderly, people who don't have air conditioning and who spend much of their time alone.
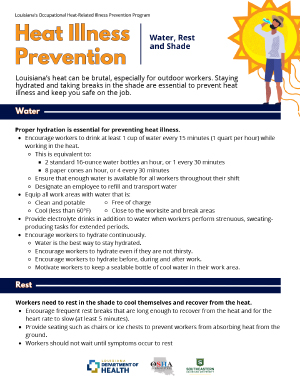
- Take extra precautions if you are working outside or in an unairconditioned space. Remember Water, Rest, and Shade. Drink 2 to 4 glasses (16–32 ounces) of water each hour and take frequent breaks in a shady or air-conditioned space.
How can alcohol and drug use contribute to heat-related illness?
Substance use can significantly contribute to an increased risk of heat-related illness. Alcohol and drugs can impact your body’s ability to regulate and respond to heat, increasing the risks that already exist from heat or substance use. In 2023, drugs and/or alcohol were involved in 31% of all heat-related deaths in Louisiana.
- Stimulants like methamphetamines, MDMA (molly/ecstasy), and cocaine affect the body’s ability to regulate temperature, decrease feelings of thirst and hunger, and increase heart rate.
- Fentanyl, heroin, benzodiazepines, and alcohol can mask heat stroke symptoms and reduce awareness, making it more difficult to recognize signs of overheating.
- People using substances may also struggle with mental health issues and/or accessing basic needs, such as lack of stable housing or access to cooled environments, putting them at a higher risk of heat illness and death due to increased heat exposure.
Prescription and Other Medications
- Some medications can increase the risk of heat-related illnesses, including heat exhaustion and heat stroke, by making it harder for the body to cool itself, sweat, and pump blood to the skin. These can include diuretics, antidepressants, heart and blood medications, and others.
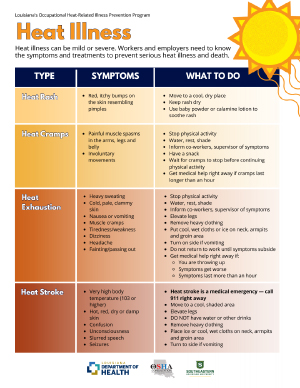
Signs of Heat-Related Illness and What to Do
What to look for
- Heavy sweating during work or exercise
- Muscle pain or spasms
What to do
- Stop physical activity and move to a cool place
- Drink water or a sports drink
- Wait for cramps to go away before you do any more physical activity
Get medical help right away
- If cramps last longer than 1 hour
What to look for
- Heavy sweating
- Cold, pale, and clammy skin
- Fast, weak pulse
- Nausea and vomiting
- Muscle cramps
- Tiredness or weakness
- Dizziness
- Headache
- Fainting
What to do
- Move to a cool place
- Loosen clothes
- Put cool, wet clothes on your body or take a cool bath
- Sip water
Get medical help right away
- If you are throwing up
- If your symptoms get worse
- If your symptoms last longer than an hour
What to look for
- High body temperature (103°F or higher)
- Skin can be hot and red, or dry and damp
- Fast, strong pulse
- Dizziness
- Nausea or vomiting
- Confusion
- Fainting or loss of consciousness
- Convulsions
What do do
- Call 911 immediately. Heat stroke is a life-threatening emergency
- Move the person to a cooler place
- Loosen clothes
- Cool the person quickly by wetting or applying ice to the neck, armpits, and groin areas
Fact Sheets and Guidance
Useful Links
- Guidance for Identifying and Certifying Disaster-Related Deaths, Sep 2025
- Louisiana Occupational Heat-Related Illness Prevention Program for more information about workers and heat
- HEAT.gov - National Integrated Heat Health Information System
- OSHA Heat Illness Prevention
- OSHA Heat Safety Tool
- National Weather Service
- Southern Climate Impacts Planning Program
- Global Heat Health Information Network
- Heat-Related Illness ICD Diagnostic Codes
Publications & Reports
- Heat-Related Mortality in Louisiana, 2023, v3
- Guidance for Identifying and Certifying Disaster-Related Deaths, September 2025
- Guidance for Identifying and Certifying Death from Environmental Heat Exposure, May 2025
- Heat-Related Emergency Department Visits in Louisiana: Review of Syndromic Surveillance Data for April through October, 2023
- Heat-Related Illness in New Orleans: Review of Emergency Department Data from 2010-2020. LDH OPH Occupational Heat-Related Illness Prevention Program, 2023
- Heat-Related Illness in Louisiana: Review of Emergency Department and Hospitalization Data from 2010-2020. LDH OPH Occupational Heat-Related Illness Prevention Program, March 2024
- Louisiana Health Alert Message: Extreme Heat Poses Serious Risk of Heat Exhaustion and Heat Stroke, August 2023
Heat-Related Illnesses
Data are from participating Louisiana (LA) Emergency Departments. Approximately 90% of Louisiana EDs provide data. Data are transmitted and processed via the National Syndromic Surveillance Program’s BioSense Platform. BioSense is a cloud-based platform that hosts the Electronic Surveillance System for the Early Notification of Community-based Epidemics, or ESSENCE, a web-based syndromic surveillance analysis system. Note that counts might change over time due to several factors: new updates and messages are continuously received, reporting facilities are onboarded and offboarded, and case query definitions are modified and refined.
Each case represents an ED visit for heat-related illness. An individual may have more than one ED visit. Records are selected using a built-in Essence query that searches the Chief Complaint (i.e., the patient’s stated reason for visit), Admit Reason (i.e., the provider’s noted reason for admission), and Discharge Diagnosis fields for text and ICD codes associated with heat exhaustion, heat exposure, heat cramps, heat stroke or hyperthermia. The Clinical Impression and Triage fields were added to the syndrome query to increase the number of cases captured.
While syndromic surveillance is a valuable near real-time data source for assessing the impacts of HRI in Louisiana, it is accompanied by some limitations that should be considered when interpreting the data. Not all ED visits in the state are included in the data analyzed (approximately 90% of EDs report data). Also, the amount of ED data received by the syndromic system may change over time due to the onboarding and off-boarding of facilities, changes in electronic health reporting systems and data outages for various reasons. This limitation should be considered when analyzing trends over time. Patients seen outside of EDs, such as at urgent care centers or by emergency medical services without transport to a hospital, are not captured. Records in ESSENCE are not verified using clinical standards to definitively classify them and so do not represent clinically confirmed diagnoses. Some cases are identified from pre-visit information. These fields may be inaccurately or incompletely reported which could result in misclassification of HRI ED visits. An example of this issue lies within the Chief Complaint category, as it relies on self-reporting and may provide ambiguous information. Data are retrieved and reported based on location of treatment facility, except for the number of HRI ED visits by parish, which is reported based on the patient’s parish of residence. While the facility location is a useful proxy for the patient’s location, it represents the location where the patient sought care which may differ from the location where the patient became ill.
Daily Temperature Estimates
Daily temperature estimates are created using nClimGrid-Daily. nClimGrid-Daily is a gridded (0.0417° or 5-km) dataset offering daily minimum, maximum, and average temperatures from 1951 to the near present. Data are maintained by the National Oceanic and Atmospheric Administration’s (NOAA) National Centers for Environment Information (NCEI). For a detailed description of the dataset, please view “Daily High-Resolution Temperature and Precipitation Fields for the Contiguous United States from 1951 to Present” by Durre et al., (2022).
Daily statewide and regional temperature estimates are created by averaging all grids within the state and regional boundaries based on Census TIGER/Line Shapefiles. The grids are created by an estimation algorithm using National Weather Service Cooperative Observer Program stations and Automated Surface Observing Systems stations. Both are National Weather Service and NCEI approved. The data are extensively quality-controlled.
Daily values represent prevailing conditions during the 24 hours ending during the morning on the observation day. For example, the estimates for April 1st represent conditions from the morning of March 31st ending during the morning of April 1st. The data generally have a latency of 1-3 days and preliminary estimates may be subject to change.
Code development and testing for temperature data were done by the Southern Climate Impacts Planning Program.
 Official Louisiana State Websites use .la.gov
  Secure .gov websites use HTTPS
