 Official Louisiana State Websites use .la.gov
  Secure .gov websites use HTTPS
 Maternal and Child Health Data Indicators Dashboard
Overview
These indicators provide a snapshot of health statistics common to maternal and child health issues. Data is available at the state, regional, and parish levels. The dashboard covers 2019-2024 data. Topics included in the dashboard are:
- Teen births
- Cesarean delivery, birth spacing, prenatal care
- Low birth weight and preterm births
- Fetal and infant mortality
For 2010-2019 data, please see the links below the dashboard. For data prior to 2010, please submit a data request form.
Notice for Media Inquiries and Journalists
If you are a reporter or journalist seeking information, please do not use this data request form. All media and public information requests should be submitted through the Public Records Request Process for proper handling. To ensure your request is directed to the appropriate team, please visit our Public Records Request webpage to submit your inquiry.
For data reports and fact sheets on maternal mortality, child death review, and more, check out the Bureau of Family Health data center.
Indicators and Definitions
Teen birth rate (per 1,000): The number of live births to women ages 15-19 years per 1,000 females ages 15-19 years.
Repeat teen births (%): The percentage of live births to women ages 15-19 years who had at least one previous live birth.
Low-risk cesarean delivery (%): The percentage of first live births delivered by cesarean section among low-risk women with no previous live births (nulliparous). A low-risk woman is defined as a pregnant woman who has a full term (37-47 completed weeks of gestation), singleton (birth of a single fetus), and vertex presentation (fetal position with head down) live birth.
Primary cesarean delivery (%): The percentage of live births delivered by cesarean among women who have not had a previous cesarean delivery.
Vaginal birth after previous cesarean delivery (%): The percentage of live births delivered vaginally among women with a previous cesarean delivery.
Births to women within 24 months of a previous live birth (%): The percentage of live births to women who had a previous live birth within the past 24 months.
No prenatal care (%): The percentage of live births to women who did not receive prenatal care during pregnancy.
Entered prenatal care in the first trimester (%): The percentage of live births to women who began prenatal care in the first trimester (first three months) of pregnancy.
Low birth weight (%): The percentage of live births weighing less than 2,500 grams (5.5 lbs.) at delivery.
Preterm birth (%): The percentage of live births born before 37 completed weeks of gestation.
Fetal mortality rate (per 1,000): The number of fetal deaths per 1,000 fetal deaths plus live births. A fetal death is an intrauterine death of a fetus before delivery. Only fetal deaths with gestational age greater than or equal to 20 completed weeks or birth weight greater than or equal to 350 grams are included.
Infant mortality rate (per 1,000): The number of infant deaths per 1,000 live births. An infant death is the death of a live-born child before their first birthday (0 - 11 months of age).
Data Presentation and Reliability Standards
Unreliable data is suppressed and displayed with an asterisk (*). Unavailable data with denominator of zero is also displayed with an asterisk (*). If the number of events is zero, the data is presented.
For rates including teen birth rate, fetal mortality rate, and infant mortality rate, if the number of events (numerator) is less than 20, the rate is considered unreliable. See the references 2 and 3 for data reliability and presentation standards for fetal mortality rate; see references 4 and 5 for infant mortality rate; and see references 6 and 7 for teen birth rate.
For percentages, the data unreliability is identified by sample size (denominator), absolute confidence interval width, and relative confidence interval width. See the reference 1 for data reliability and presentation standards for percentages.
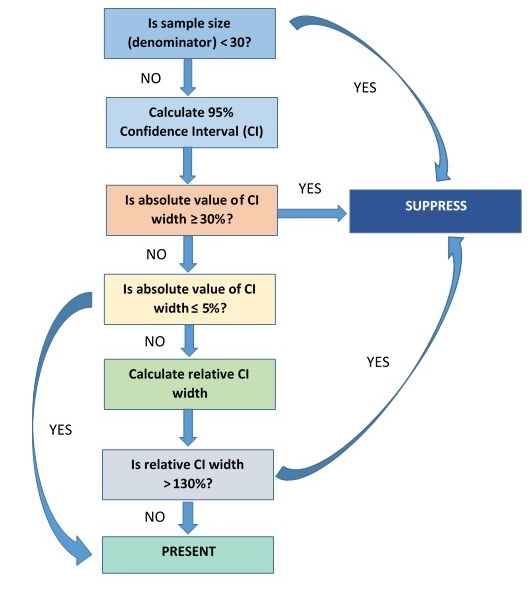
The chart below indicates the data reliability standards and presentation for percentages. The data are considered statistically unreliable and displayed with an asterisk (*) if the sample size is (1) less than 30, (2) absolute value of confidence interval (CI) width is greater than or equal 30%, or (3) absolute CI width greater than 5% and relative CI width greater than 130%.
Confidence interval: A confidence interval is a range of values that is likely to contain the true population estimate with a specified level of confidence. It is typically expressed as a range with an upper and lower bound. The confidence interval helps determine the precision or reliability of an estimate. It is commonly expressed as 95% confidence interval indicating that if 100 random samples are drawn from a population, the true population estimate should fall between lower and upper bounds in 95 of those samples.
Confidence interval (CI) calculations:
For percentages: 95% CI is calculated by using the Clopper-Pearson method for binomial distribution data. See the reference 1 for the method of calculation of CI for percentage.
For rates: 95% CI is calculated by using the method for Poisson distribution data. The calculations are done differently for a number of event (numerator) less than 100 and greater than or equal to 100. See the reference 5 for CI calculation method for fetal mortality rate; references 2 and 3 for infant mortality rate; and reference 7 for teen birth rate.
Absolute confidence interval width: Absolute CI width is calculated by subtracting the lower bound from the upper bound of confidence interval.
Relative confidence interval width: Relative CI width is calculated as the absolute confidence interval width divided by the percentage estimate and multiplied by 100%.
References
- Parker JD, Talih M, Malec DJ, et al. National Center for Health Statistics Data Presentation Standards for Proportions. National Center for Health Statistics. Vital Health Stat 2(175). 2017. https://www.cdc.gov/nchs/data/series/sr_02/sr02_175.pdf
- Murphy SL, Kochanek KD, Xu JQ, Arias E. Deaths: Final data for 2021. National Vital Statistics Reports; vol 73 no 8. Hyattsville, MD: National Center for Health Statistics. 2024. DOI: https://dx.doi.org/10.15620/cdc/158787
- National Center for Health Statistics. Vital statistics of the United States: Mortality, 1999. Technical appendix. 2004. https://www.cdc.gov/nchs/data/statab/techap99.pdf
- Gregory ECW, Valenzuela CP, Hoyert DL. Fetal mortality: United States, 2022. National Vital Statistics Reports; Vol 73 No 9. Hyattsville, MD: National Center for Health Statistics. 2024. DOI: https://dx.doi.org/10.15620/cdc/158788.
- National Center for Health Statistics. User Guide to the 2022 Fetal Death Public Use File. Hyattsville, MD. 2024. https://ftp.cdc.gov/pub/Health_Statistics/NCHS/Dataset_Documentation/DVS/fetaldeath/2022fetaluserguide.pdf.
- Osterman MJK, Hamilton BE, Martin JA, Driscoll AK, Valenzuela CP. Births: Final data for 2022. National Vital Statistics Reports; vol 73, no 2. Hyattsville, MD: National Center for Health Statistics. 2024. DOI: https://dx.doi.org/10.15620/cdc:145588.
- National Center for Health Statistics. User Guide to the 2022 Natality Public Use File. https://ftp.cdc.gov/pub/Health_Statistics/NCHS/Dataset_Documentation/DVS/natality/UserGuide2022.pdf
- Maternal and Child Health Data Indicators, 2017-2019
- Maternal and Child Health Data Indicators, 2016-2018
- Maternal and Child Health Data Indicators, 2015-2017
- Maternal and Child Health Data Indicators, 2014-2016
- Maternal and Child Health Data Indicators, 2013-2015
- Maternal and Child Health Data Indicators, 2012-2014
- Maternal and Child Health Data Indicators, 2010-2012